
In this post I’ll walk you through attaching a debugger to a Sitecore application running on a remote server. If you’re in a pinch dealing with a production issue and looking for a TL;DR on the MSDN documentation hopefully this will help. I’m assuming you’re using Visual Studio 2015, but the steps are largely the same for earlier versions.
Installing and Starting the Remote Debugger service
You’ll need to download the appropriate remote debugger for the version of Visual Studio you’re using. To start the service, you’ll need administrator permissions on the remote machine. If you don’t have that, find someone who does to set up and start the service for you.
If you have an account on the remote machine, to connect you’ll need an account on the local machine with the same domain and username to connect. It’s easier to select “No Authentication” and “Allow Any User to Debug”, but be warned there are security concerns. I don’t recommend this option unless there’s an additional layer of security in your system, such as IP filtering. You should also change the default port.

Attaching the Debugger
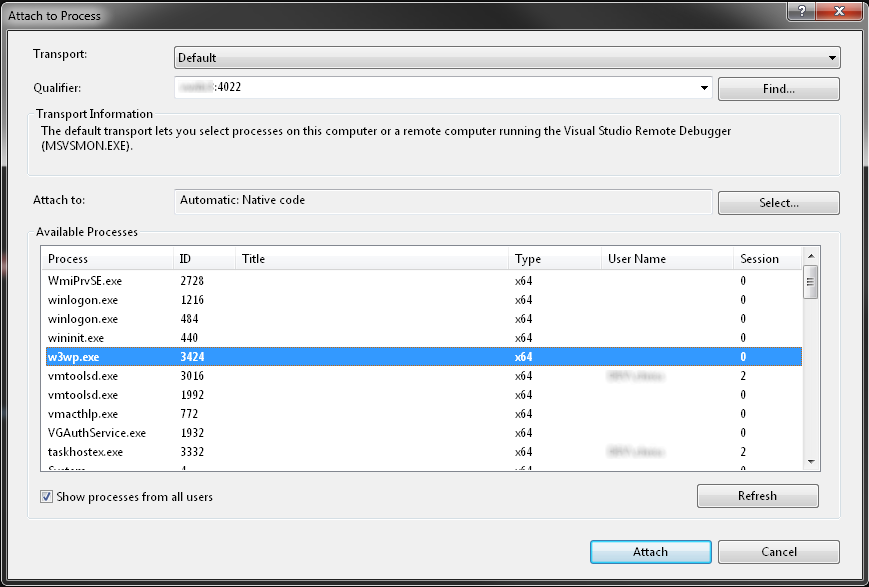
Once the service is listening, open your project in Visual Studio and select Attach to Process from the Debug menu. In the dialog box, under Transport, select Default if using Windows Auth, or No Authentication if using the No Authentication option on the remote server. In the Qualifier box, put in the server:port and hit enter. If the remote debugger is listening, you’ll see a list of processes running on the remote machine. Select w3wp.exe from the list and attach. That’s it! You’re now attached and ready to debug your remote application.
Why can’t I hit my breakpoints?
Chances are, unless you built the app and deployed the DLLs from your local machine, you won’t be able to hit any breakpoints you set. In order for the remote debugger to function, it needs the exact same symbols (pdb) files from the remote machine. You’ll need to copy these down to the machine you’re debugging from and tell Visual Studio where to find them.
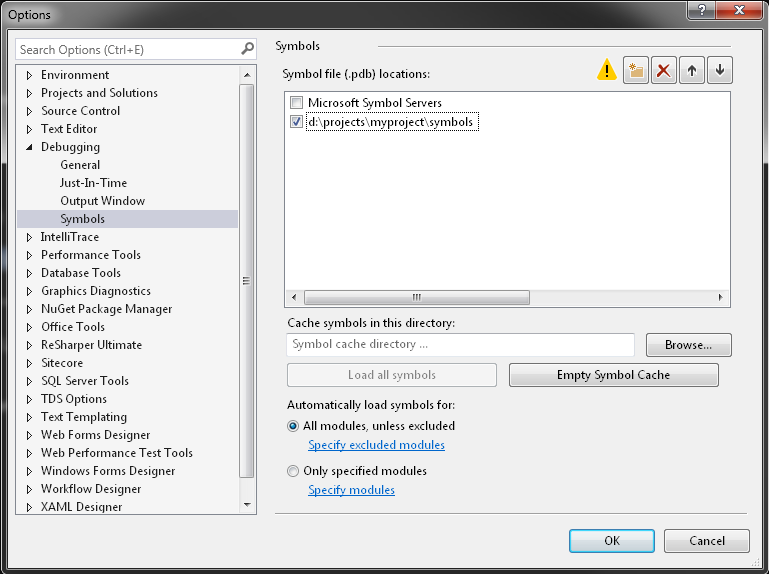
Once you’ve copied the symbols to a local folder, open the Tools -> Options dialog from Visual Studio. Select Debugging -> Symbols, and add a new path by clicking the folder icon. Paste in the path to where you copied down the pdb files and make sure the box is checked next to that new entry. Close this and reattach the remote debugger.
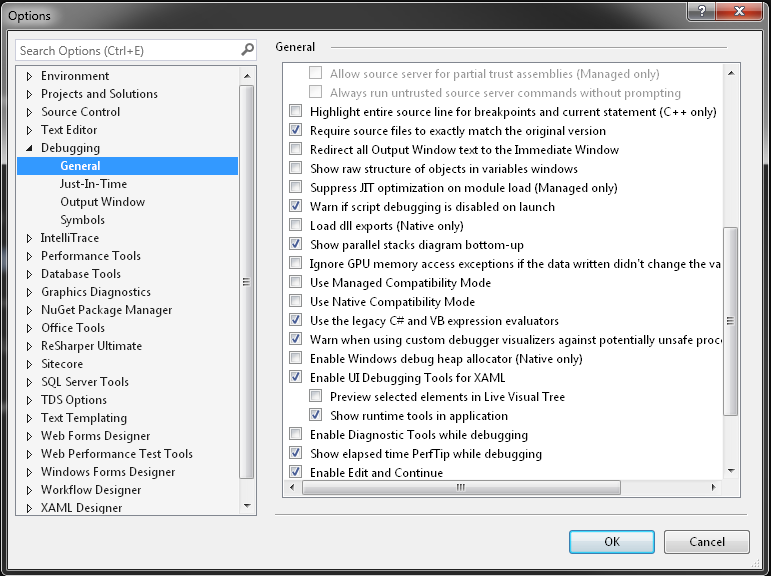
Why can’t see my variable values?
Try this. In the Tools -> Options dialog, under Debugging, check the “Use Legacy C# and VB Expression evaluators”.
Happy debugging, and remember to turn off your remote debugger when you’re finished!